How to Make a Timeline in Google Docs
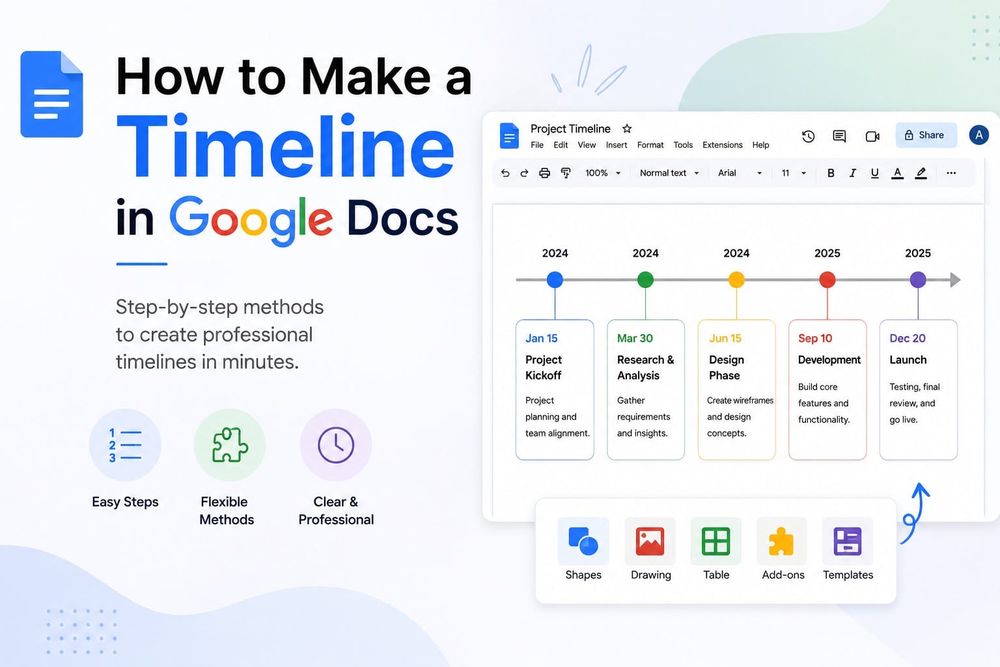
Google Docs gives you two usable methods for building a timeline: the Drawing tool and a table. Neither is perfect. The Drawing tool produces a proper visual timeline but every element is manually positioned, which gets tedious fast. The table method is faster to build and easier to edit, but it looks more like a schedule than a timeline. I've used both on documentation projects and the right choice depends entirely on how you'll use it.
Below I'll walk through both approaches step by step, then tell you when each actually makes sense.
How to Make a Timeline in Google Docs Using the Drawing Tool
This is the method most tutorials cover, and it works well for timelines with 8 to 12 milestones. Beyond that, it becomes a spacing nightmare.
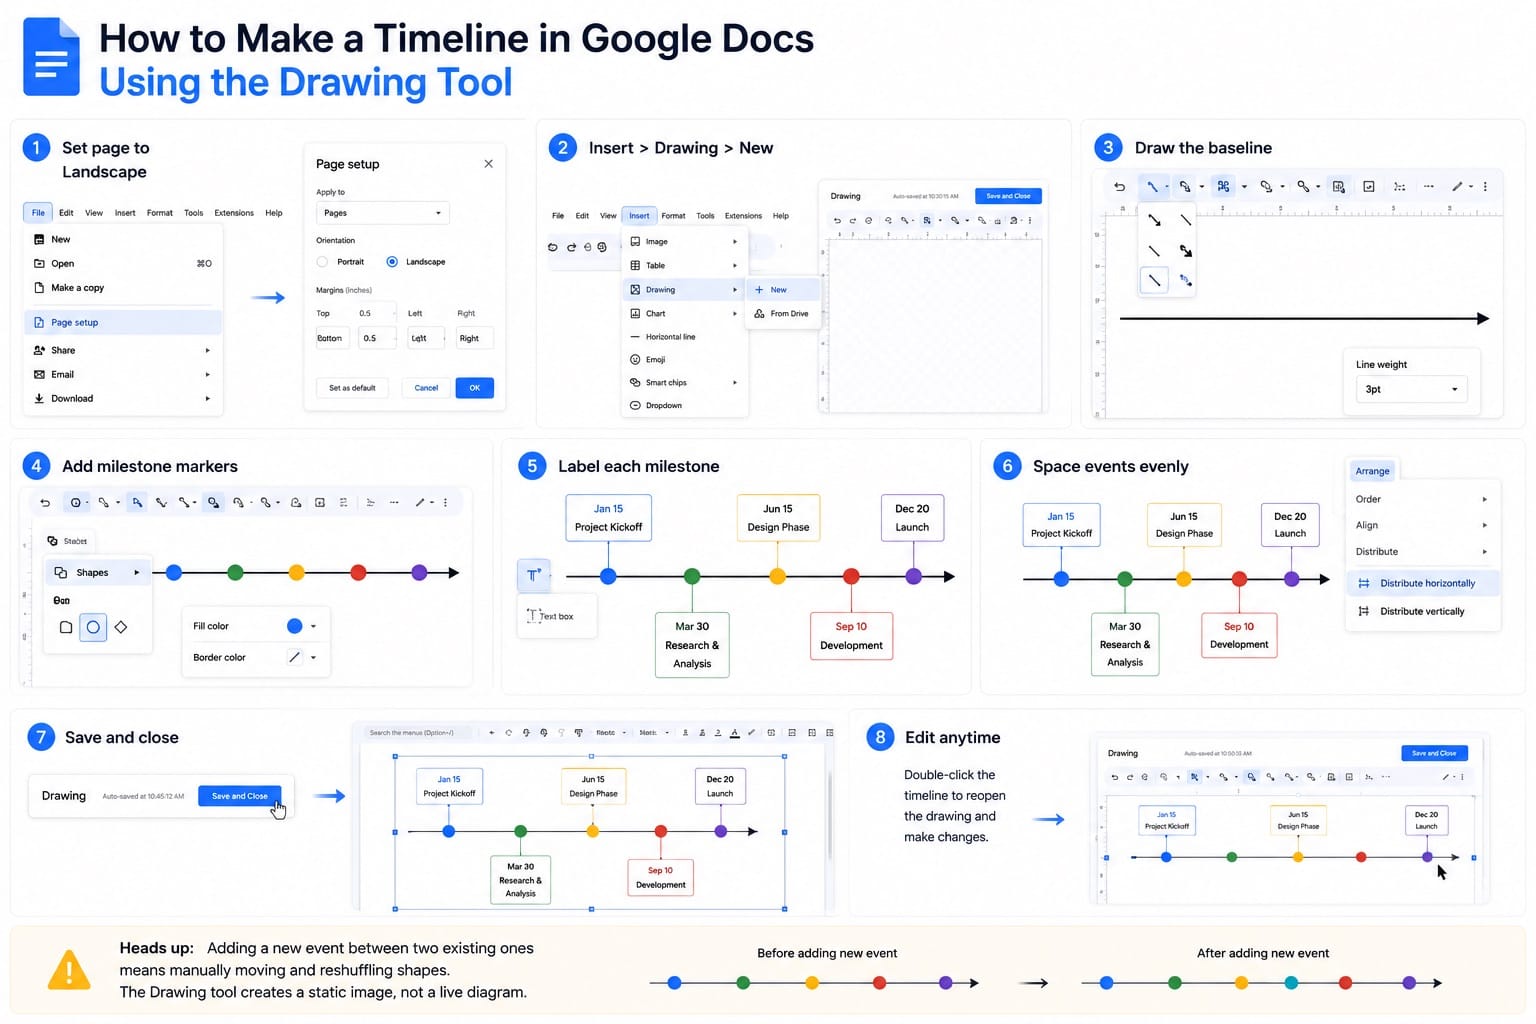
Before you open the drawing canvas, switch your document to landscape orientation. If your document is in pageless format, switch to pages format first. Page orientation and margins are only available in pages format. Go to File > Page setup, select Pages, then set the orientation to Landscape and click OK. The default portrait layout gives you limited horizontal space. Landscape gives you much more room for dates, labels, and milestone markers. That difference matters when you have 7 or more events to fit.
Reduce your margins too. Under the same Page setup dialog, set all four margins to 0.5 inches instead of the default 1 inch. That adds another inch of drawing space without affecting readability.
Now go to Insert > Drawing > New. A drawing canvas opens over your document.
- Draw the baseline. Click the Line tool, select Arrow, and drag a horizontal line across the canvas from left to right. Hold Shift while dragging to keep it perfectly straight. Once drawn, click the line and use the toolbar to increase the weight to 2pt or 3pt so it's visible at normal zoom.
- Add milestone markers. Click the Shape tool, pick Circle or Diamond, and draw a small shape directly on the line where your first milestone sits. Set a fill color, remove the border if you want a cleaner look, then copy-paste it for every subsequent milestone. Moving copies is faster than redrawing.
- Label each milestone. Click the Text Box tool (the T icon), draw a box above or below a milestone shape, and type the date and event name. Keep labels short. "Q1 Launch — March 14" works better than a full sentence. Alternate labels above and below the line if you're tight on space. This is standard practice for horizontal timelines and immediately makes things more readable.
- Space events evenly. Select all your milestone shapes, then use Arrange > Distribute horizontally to spread them at equal intervals. This saves you from manually nudging each one. It only works well if your events are roughly evenly spaced in time — if they're not, you'll need to position them manually to reflect the actual gaps.
- Click Save and Close. The timeline embeds as a resizable image in your document. Double-click it any time to reopen the canvas and edit.
One honest warning: if you need to add a new event between two existing ones, you'll spend 10 minutes reshuffling shapes. There's no auto-reflow. That's the real limitation of the Drawing tool — it's a static image, not a live diagram.
How to Make a Google Docs Timeline Using a Table
Tables work better when you need to share dates, owners, and status alongside each milestone, or when the document will be edited by multiple people regularly. A table is easier to update than a drawing and far more readable on mobile.
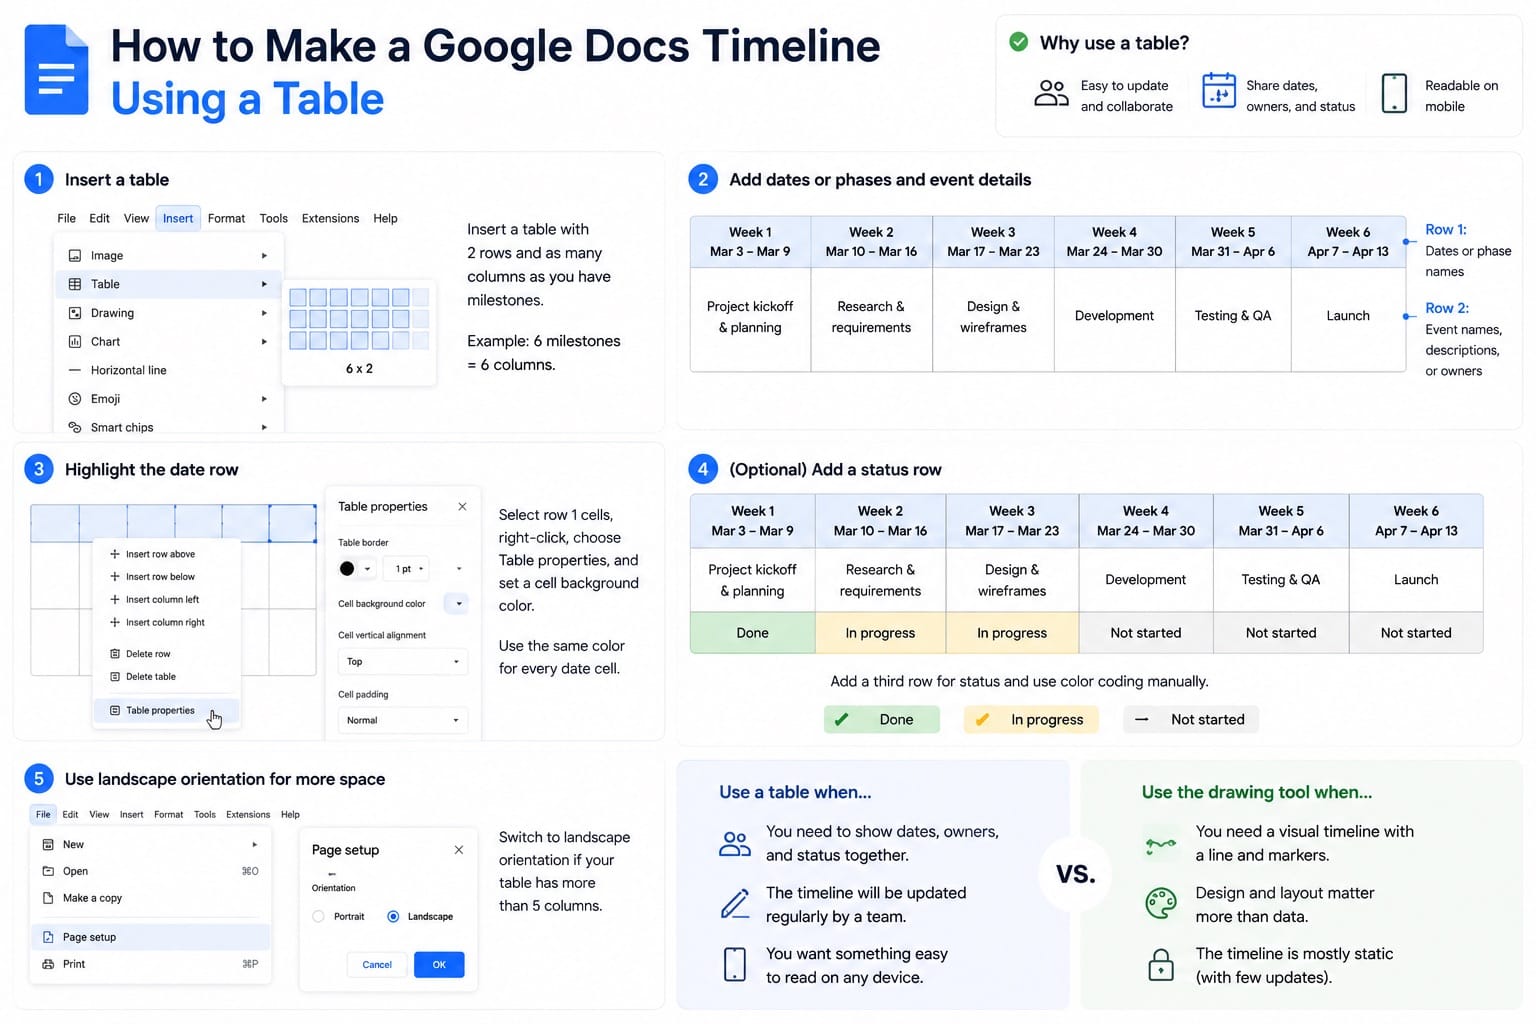
Go to Insert > Table and insert a table with 2 rows and as many columns as you have milestones. If you have 6 milestones, insert 6 columns.
- Row 1: Dates or phase names (e.g., "Week 1", "March 14", "Phase 2")
- Row 2: Event names, descriptions, or owners
Set the first row to a background color so dates stand out visually. Select row 1 cells, right-click, choose Table properties, and set a cell background color. Use the same color for every date cell to give it a visual rhythm.
You can add a third row for status (Not started / In progress / Done) and use conditional color coding manually. It won't update automatically, but for a shared team doc it's often good enough.
Switch to landscape orientation here too if your table has more than 5 columns. Portrait layout will compress each column to the point where text wraps badly.
The table method doesn't look like a traditional timeline with a horizontal line and markers. If your audience needs a visual diagram, use the Drawing tool. If they need a scannable reference they'll actually update, use a table.
Google Docs Timeline Limitations You Should Know
Both methods have real constraints worth understanding before you start.
The Drawing tool has no automatic date spacing. If your project spans 3 months and one milestone falls on day 4 while the next falls on day 73, both markers will sit wherever you manually place them. You're creating a visual impression of a timeline, not an accurate proportional representation. For internal communication, that's usually fine. For client-facing planning docs, it can mislead.
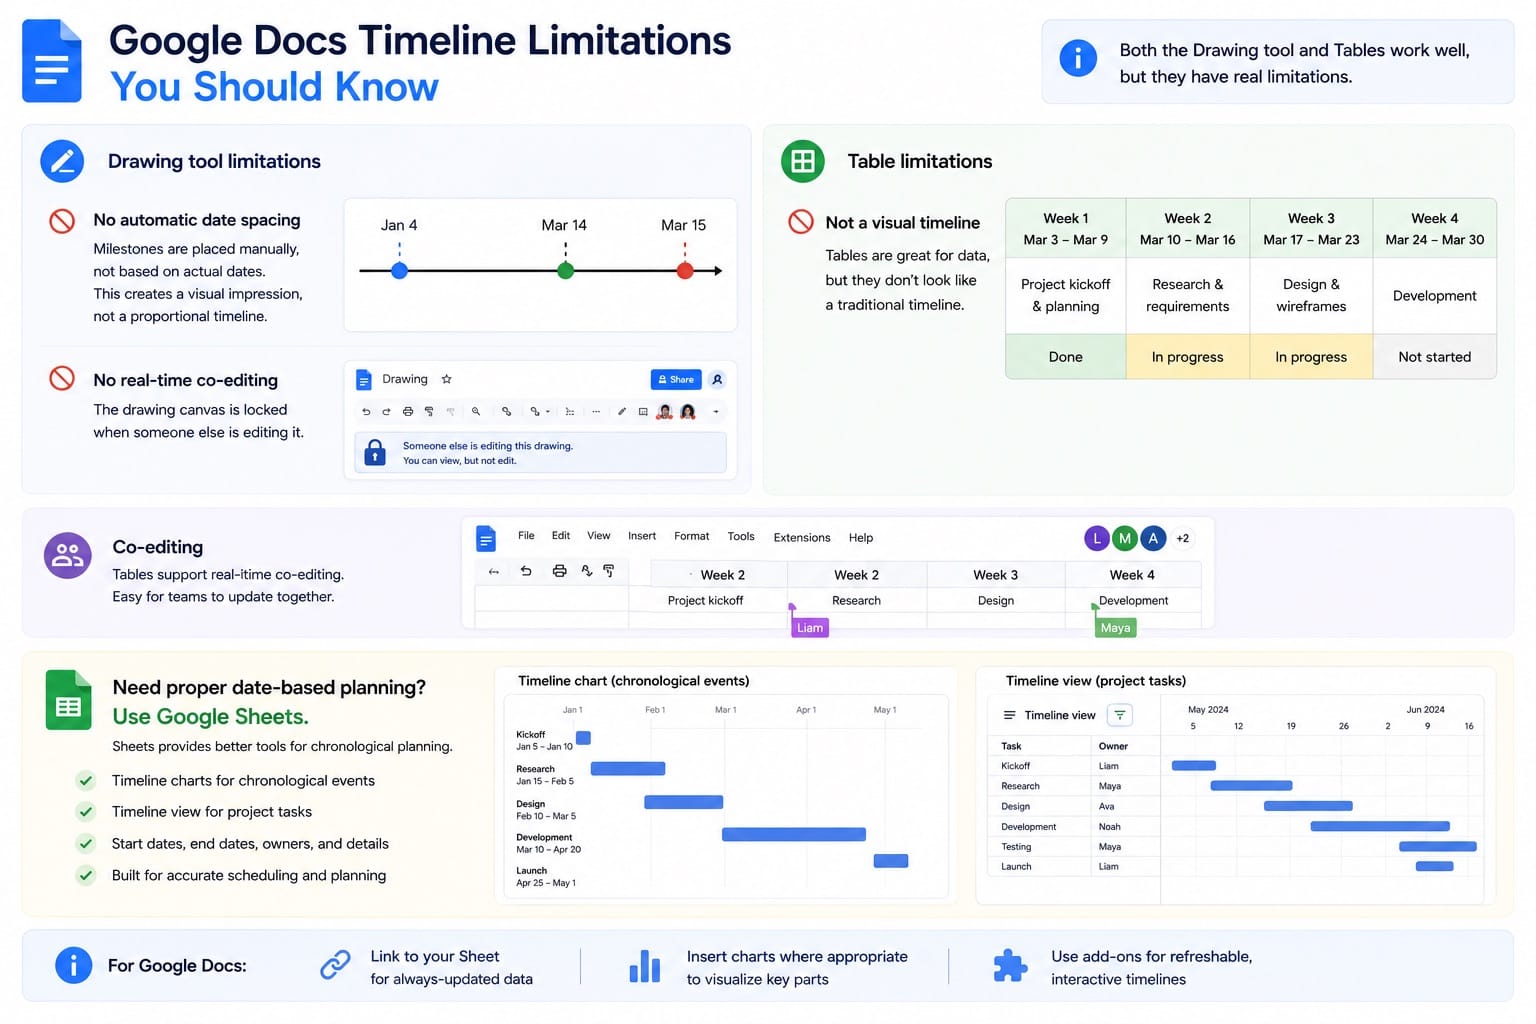
There's also no real-time co-editing inside the Drawing canvas. Two people can edit a Google Doc simultaneously, but the embedded drawing is effectively locked when one person has it open.
Tables don't have these issues, but they don't produce anything that looks like a traditional timeline. For presentations, you'll want something more visual.
If you need proper date-based planning, use Google Sheets instead. Sheets has timeline charts for chronological events and a Timeline view for project tasks with start dates, end dates, owners, and planning details. For a Google Doc, you can link to the Sheet, insert a chart where appropriate, or use an add-on that creates a refreshable visual.
Google Docs Timeline Templates: What's Worth Using
Google Docs has a template gallery, but it does not have a dedicated timeline builder. Most "Google Docs timeline templates" you find online are third-party documents you copy into your Drive. That can be useful, but they are usually still built from drawings, tables, or pasted visuals rather than a native timeline feature.
If you copy a template, paste it in landscape mode with margins set to 0.5 inches. Many template files were built with custom page setups that don't carry over when you copy sections between documents.
For teams running Google Workspace, Office Timeline Online can import project data from Google Sheets and embed refreshable timeline visuals into Google Docs or Slides. That makes more sense for living project plans than manually moving shapes inside the Drawing tool. It's not free for advanced features, but it solves the core problem with the manual Drawing method.
Which Google Docs Timeline Method Should You Use
Use the Drawing tool when you need a visual timeline for a document someone will read once — a project proposal, a kickoff doc, a report. A simple 8-milestone timeline is manageable, but it still takes manual spacing and cleanup. The result looks professional enough for most internal use.
Use a table when the document is a living reference. Team members will update it, statuses will change, new milestones will be added. Tables are forgiving in a way that drawings are not.
Use a Sheets timeline chart or an add-on when accuracy matters — when dates are close together, when milestones span a real calendar, or when someone downstream will use the timeline for actual planning decisions. The Drawing tool is a communication aid. It's not a planning tool.
Frequently Asked Questions About Google Docs Timelines
Can I make a timeline in Google Docs without the Drawing tool?
Yes. Use a table with dates in the top row and events in the row below. It won't look like a traditional timeline with a horizontal line and markers, but it's easier to edit and works well for documentation and shared team references.
Does Google Docs have a built-in timeline template?
Google Docs has a template gallery, but it does not have a dedicated timeline builder. Most timeline templates you find online are third-party documents you copy into your Drive. They can be useful, but they are still usually pre-built drawings, tables, or pasted visuals rather than a native timeline feature.
Can multiple people edit a Google Docs timeline at the same time?
Not if it's built with the Drawing tool. The embedded drawing locks when one person has it open for editing. A table-based timeline doesn't have this problem since it's standard document content.
What's the best orientation for a timeline in Google Docs?
Landscape is best for most timelines. Go to File > Page setup and select Landscape, then reduce margins if you need more horizontal space. If your document is in pageless format, switch back to pages format first, because orientation and margin settings are not available in pageless documents.
How many milestones can you fit on a Google Docs timeline?
In landscape mode with 0.5-inch margins, 8 to 12 milestones is a practical limit before label text starts overlapping. Alternating labels above and below the baseline gives you more room. For more than 13 events, consider a Sheets timeline chart instead.